
>
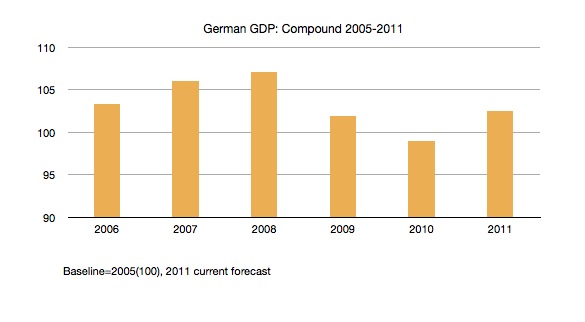
…but what with the government crowing about “the strongest annual GDP growth (3.8%) since reunification and it’s only because of our Good Work”, I thought I’d have a closer look.
Given that GDP growth has been in the range of “sod all to oops” over the past couple of years (2008:1%, 2009:-4.88%, 2010:-2.88%) doesn’t this chart REALLY say that we’re not quite back where we were in 2006 and that the significant growth this year is REALLY only folks buying stuff that they haven’t bought for the past 2 years?
But I’ve probably got it wrong and one of the professors (International business/Geology/Biochemistry/Maths) is bound to make me look like the fool that I really am.

